
What companies like yours are doing with video
shootsta.
What companies like yours are doing with video
By Shootsta · Published May 26, 2026 · Updated May 2026
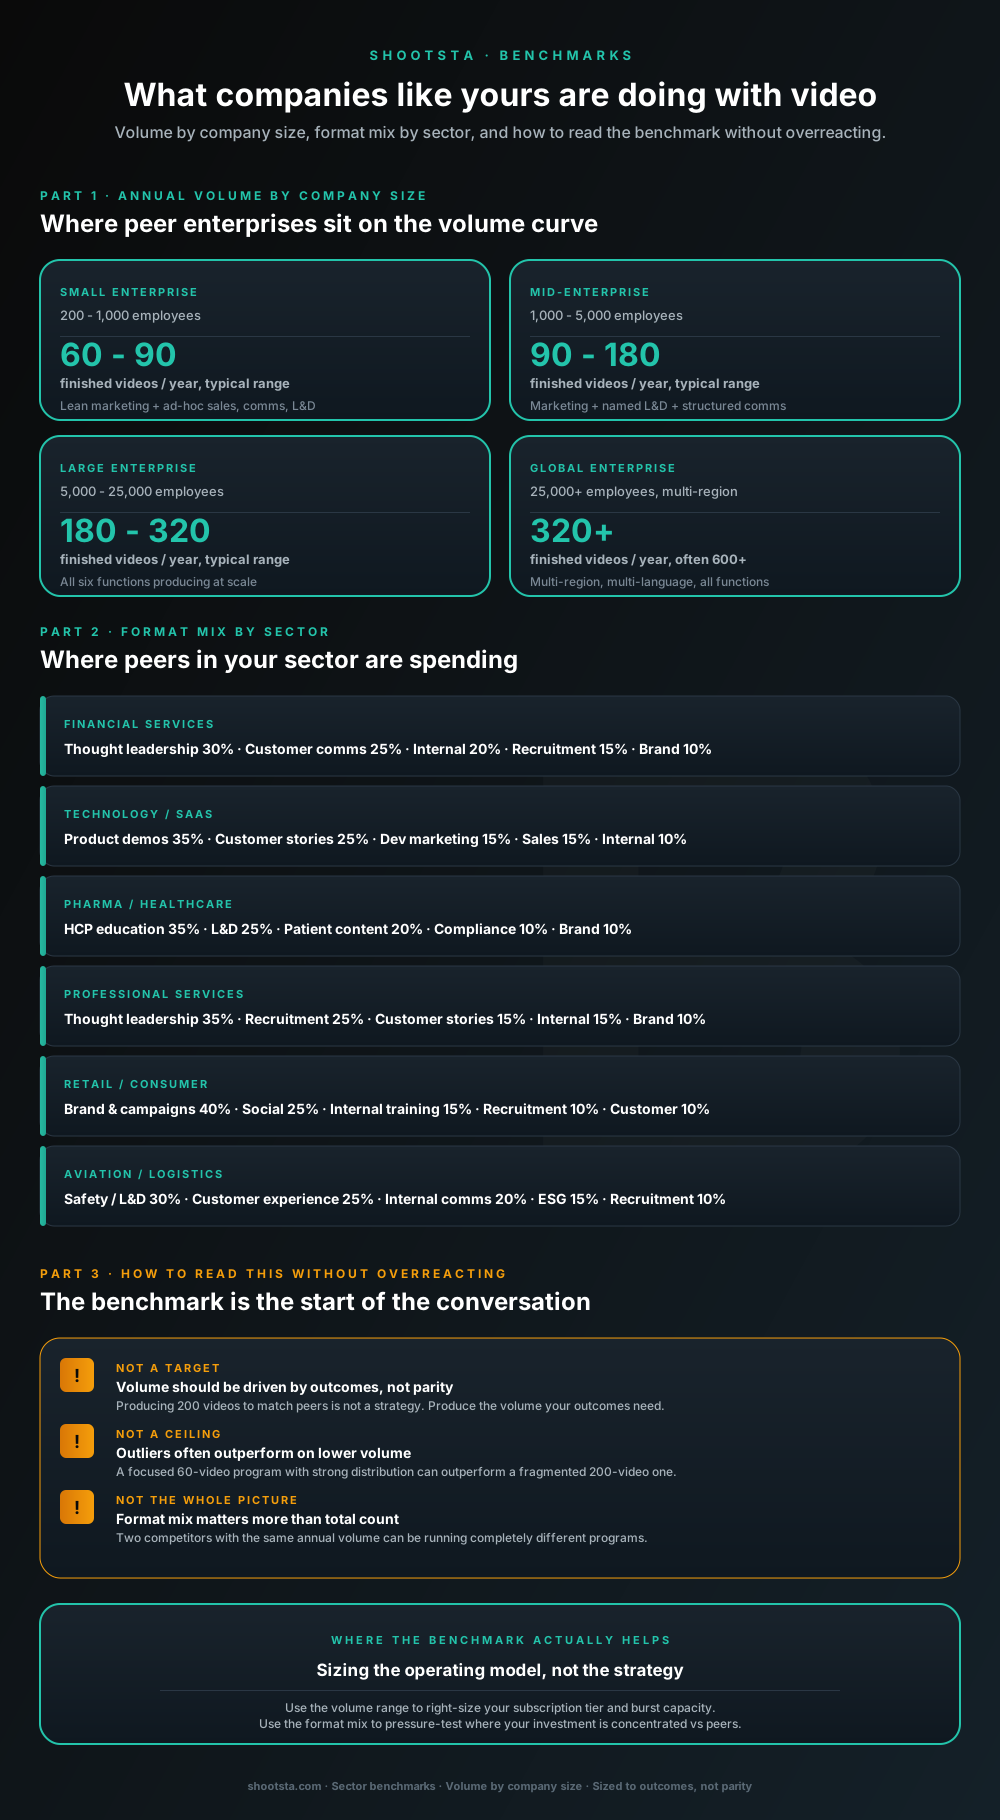
Most enterprise buyers ask this question as a sanity check, not a target. Here is what peer enterprises actually produce by company size and sector, where most programs sit on the volume curve, and how to read the benchmark without making the wrong move based on it.
Why the "what are competitors doing" question matters
Almost every enterprise video conversation includes a version of "what are companies like us doing?" Sometimes it is FOMO ("we are falling behind"). Sometimes it is a sanity check ("are we wildly over or under-investing?"). Sometimes it is internal politics ("I need a number to take into the budget meeting"). All three are legitimate.
The risk is using the benchmark as a target. Producing 200 videos because peers produce 200 videos is not a strategy. The right way to read peer data is: use volume ranges to size the operating model, use format mix to pressure-test where investment is concentrated, and use both as conversation starters rather than as decisions on their own.
Annual volume by company size
Peer enterprises fall into four reasonably stable size bands. Volume ranges are typical across customers we work with, with industry research and procurement disclosures triangulated against our own data.
Small enterprise (200 to 1,000 employees)
Typical volume: 60 to 90 finished videos per year. Programs at this size usually have a lean marketing function as the centre of gravity, with sales, comms and L&D producing ad-hoc work. Most growth in volume comes from the first formal central operating model (one platform, one set of brand templates) rather than from any single function ramping up.
Mid-enterprise (1,000 to 5,000 employees)
Typical volume: 90 to 180 finished videos per year. Programs at this size usually have marketing as the named owner, a structured comms function, and a recognisable L&D team producing modules. This is the band where consolidating from regional vendors to a single operating model has the highest immediate impact, because the volume justifies the platform investment.
Large enterprise (5,000 to 25,000 employees)
Typical volume: 180 to 320 finished videos per year. All six functions (marketing, sales, comms, L&D, recruitment, customer success) are typically producing at scale. The risk here is fragmentation: each function running its own vendor stack with no central brand custodian. The opportunity is also fragmentation: a single consolidated program at this size delivers strong cost-per-video efficiency.
Global enterprise (25,000+ employees, multi-region)
Typical volume: 320+ finished videos per year, often 600+. Multi-region, multi-language, all six functions plus regional variants. The right model at this size is a global MSA with regional execution, as covered in how to scale video across global offices.
Format mix by sector
Volume tells you how much. Format mix tells you what. The sector you operate in is the strongest predictor of where most enterprise spend concentrates.
Financial services
Thought leadership 30%. Customer comms 25%. Internal comms 20%. Recruitment 15%. Brand 10%. The thought-leadership weight is driven by trust-based selling cycles; the customer comms weight is driven by retention-led economics; the internal weight is driven by distributed workforces. Brand pieces sit lighter because direct response and trust signals do most of the work.
Technology and SaaS
Product demos 35%. Customer stories 25%. Developer marketing 15%. Sales enablement 15%. Internal comms 10%. Heavy lean toward bottom-of-funnel content: product walkthroughs, demos, customer proof. The fastest-iterating sector category, so the volume runs higher per employee than other sectors.
Pharma and healthcare
HCP education 35%. L&D and training 25%. Patient content 20%. Compliance 10%. Brand 10%. The HCP and L&D weight reflects the regulated education burden inside pharma and healthcare. Compliance is its own category because the review cycles are long enough to warrant a separate budget line.
Professional services
Thought leadership 35%. Recruitment 25%. Customer stories 15%. Internal comms 15%. Brand 10%. The recruitment weight is heavier than most sectors because talent is the product. Thought leadership runs heavy because the buying signal is intellectual credibility.
Retail and consumer
Brand and campaigns 40%. Social and always-on 25%. Internal training 15%. Recruitment 10%. Customer 10%. The most brand-led mix of any sector. Campaign work and always-on social make up two-thirds of the program because consumer audiences respond to volume and rhythm more than to depth.
Aviation and logistics
Safety and L&D 30%. Customer experience 25%. Internal comms 20%. ESG 15%. Recruitment 10%. The safety and L&D weight is driven by regulator requirements and workforce distribution. ESG is its own category at typical 15% because aviation faces sustained sustainability scrutiny.
Other sectors
Education, government, energy and other sectors each have their own characteristic mixes that share patterns with the six above. Education leans heavy on admissions and student stories; government leans heavy on public information and internal comms; energy leans heavy on safety, ESG and community engagement.
Interactive benchmark
Where do you sit against peers in your sector?
Pick your company size and sector, then set your current annual video volume. The tool surfaces the peer range, the typical sector format mix, and the highest-leverage move given where you sit.
Peer range
90 to 180
for mid-enterprise
Your position
Below range
75 below peer midpoint
Peer midpoint
135
videos / year
Typical format mix in financial services
- 30%Thought leadership
- 25%Customer comms
- 20%Internal comms
- 15%Recruitment
- 10%Brand
The honest read
You are running below the peer range. That is not automatically a problem - if your outcomes are being hit, the lower volume is efficiency, not weakness. If outcomes are stalling, the gap is usually evidence the program is undersized. Compare against your business outcomes first, peers second.
Talk through your specific positionRanges are observed across Shootsta enterprise customers and industry research. Volume should be driven by your business outcomes, not by peer parity. Use the benchmark to size the operating model and pressure-test the format mix, not as a target.
How to read the benchmark without overreacting
Three reasonable cautions before you act on peer data.
The benchmark is not a target
Producing 180 videos to match peers is not a strategy. Produce the volume your outcomes require, no more. If your outcomes are being hit at 60 videos a year, you are running an efficient program and the peer comparison is a distraction. If your outcomes are stalling at 60 videos a year, the gap to peers is evidence the program is undersized but it is not the proof. Outcomes are.
The benchmark is not a ceiling
Outliers often outperform on lower volume. A focused 60-video program with strong distribution and clear outcome attribution can outperform a fragmented 200-video program where nobody knows what the videos are for. The ceiling is set by the strategy and distribution layer, not by the production layer. We covered the distribution side in how to measure enterprise video success.
The benchmark is not the whole picture
Two companies in the same sector with the same annual video volume can be running completely different programs. One might be 70% L&D, the other 70% sales enablement. Format mix matters more than total count, especially when you are deciding where to invest next.
Where the benchmark actually helps
Two places.
Sizing the operating model
If your annual volume is in the peer range, sizing the operating model (subscription tier, burst capacity, regional coverage) becomes straightforward. The tier that fits a mid-enterprise at 120 videos a year is well-tested. The volume range is a confidence signal that your operating-model choice is reasonable.
Pressure-testing format mix
Compare your current format mix to the sector default. If your spend is 60% brand campaigns and the sector default is 40%, that is a deliberate choice you should be able to defend. If you cannot defend it, the mix needs a review. The benchmark is useful as a forcing function for "are we investing where the rest of the sector is, and if not, why".
What to do if you are below the peer range
Three possibilities, ranked by frequency.
One: your outcomes are being hit and the lower volume is efficiency. Stay where you are. Use the saved capacity for distribution depth (multi-format cutdowns, channel-fit edits) rather than for more volume.
Two: your outcomes are stalling because the program is undersized. The peer range tells you roughly how much more volume might unblock the outcomes. Move into the bottom of the peer range, not the middle, and reassess in two quarters.
Three: you do not know whether outcomes are being hit because you are not measuring them. Fix the measurement layer first. We covered this in how to measure enterprise video success. Without outcome data, peer comparison is guessing.
What to do if you are above the peer range
Two patterns.
One: the outcomes are compounding and the spend is justified. Keep going. Push for distribution depth and asset reuse to compound the existing volume.
Two: the spend is climbing faster than the outcomes. This is the more dangerous case because the volume looks like a strength internally. The fix is to audit cost per outcome by format and concentrate spend on the formats with the strongest signal. Producing more of what is not working is not a strategy.
Frequently asked questions
Where do these benchmark numbers come from?
Triangulated across three sources: Shootsta's own customer base (~500+ enterprise customers across 9 sectors), publicly disclosed video program data from large enterprises in procurement filings and case studies, and industry research from analysts who survey video programs. The ranges are deliberately wide because the variance within each band is real.
How do we benchmark against direct competitors specifically?
Direct competitive benchmarking is harder because individual program data is rarely public. The best proxies are: public-facing video footprint on YouTube and LinkedIn (count visible content over 12 months), job listings for video-related roles (signals internal investment), and any procurement disclosures if your competitor is public. Sector averages are usually more useful than competitor-specific data anyway.
Should we copy our biggest competitor's program?
No. Your competitor's program is sized for their outcomes, distribution channels, brand position and budget. Copying it usually produces a worse version of their program with none of the structural advantages they have. Reading what they do is useful as orientation; copying is not strategy.
How fast can we close a volume gap to peers?
If the gap is 30% or less, one to two quarters with the right operating model. The first project ships in 2 to 3 weeks; capacity scales as your in-house team can brief. Gaps over 50% usually take three to four quarters because the strategy and measurement layers need to mature alongside the production volume. We covered the rollout in how to build a video strategy from scratch.
Does company growth rate change the right volume?
Yes. High-growth companies (40%+ YoY) typically run video volume ahead of their company size band because content has to keep pace with hires, customers and territories arriving faster than the company can absorb them. Slow-growth or steady-state companies sit closer to or below the band average because content needs are more stable.
What about new categories like AI-generated video?
Most peer enterprises in 2026 are running AI assistance inside production workflows (auto-captioning, motion templates, voice cleanup) rather than producing fully AI-generated finished video for brand-led content. The exception is high-volume internal content like training and FAQ where AI generation is more accepted. The benchmarks above include AI-assisted production; they do not yet include fully AI-generated brand content because performance and brand control on that category are still uneven.
Where to go next
For the operating model that supports volume at the peer range, read how a video partner extends your in-house team. For the budget framing leadership will ask for once you decide on the right volume, read the business case for enterprise video. For the function-by-function map that informs format mix, read how enterprise teams actually use video.
To benchmark your specific program against sector peers and scope the operating model, book a free consultation.
Take this article with you
Read the latest at shootsta.com/blog/what-companies-like-yours-are-doing-with-video
You might also like
How to Brief an Animation Project
How to Brief an Animation Project
An animation brief is the document you send to your production partner before work starts. Get it right and you cut revision cycles in half. Get it wrong and you discover mid-production that everyone disagrees on what the video is actually for. This is what a complete brief looks like.
Animation for change management comms
Animation for change management comms
Animation handles change management communications better than live video for three reasons: no on-camera executives required during sensitive periods, scene-level updates when plans shift, and a single production that works across global teams with voiceover-only language swaps.
How sales leaders should use video at scale
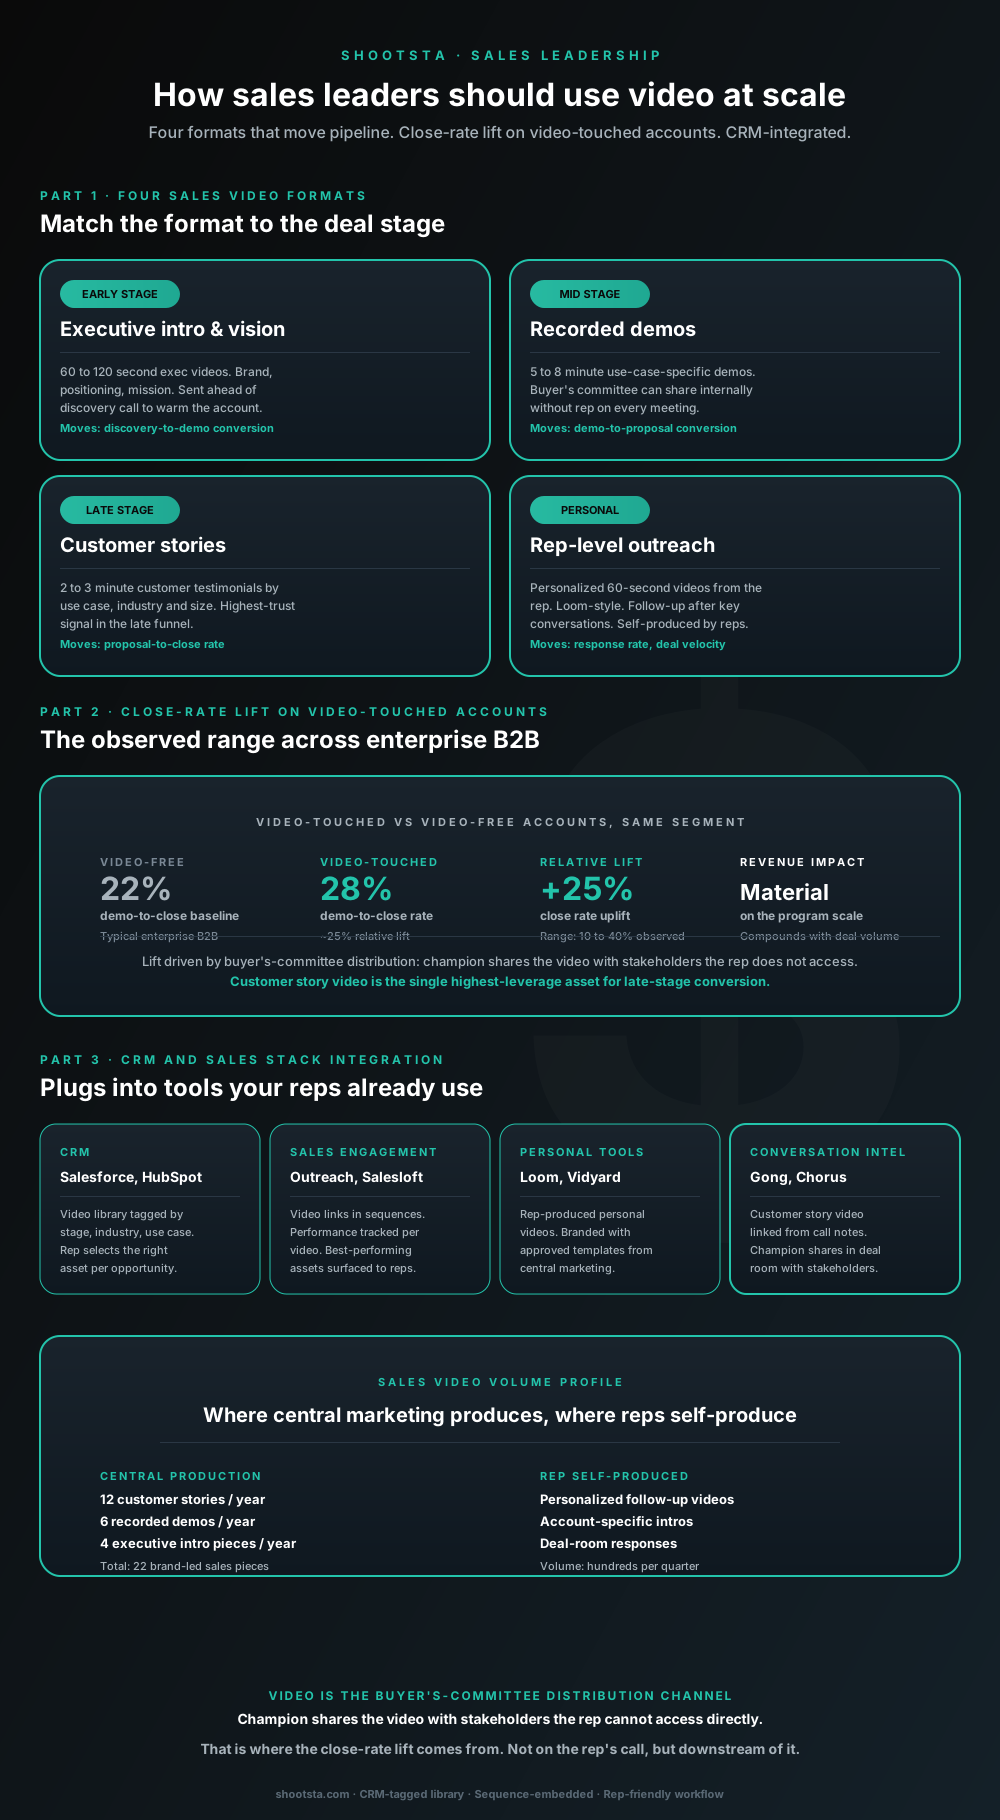
Sales leaders mostly think about video as personalized rep outreach (Loom, Vidyard) or as marketing-produced customer stories. Both are useful. The bigger opportunity is the buyer's-committee distribution layer: assets the champion shares internally with stakeholders the rep does not access directly. That is where the close-rate lift compounds.
How L&D leaders replace classroom with video
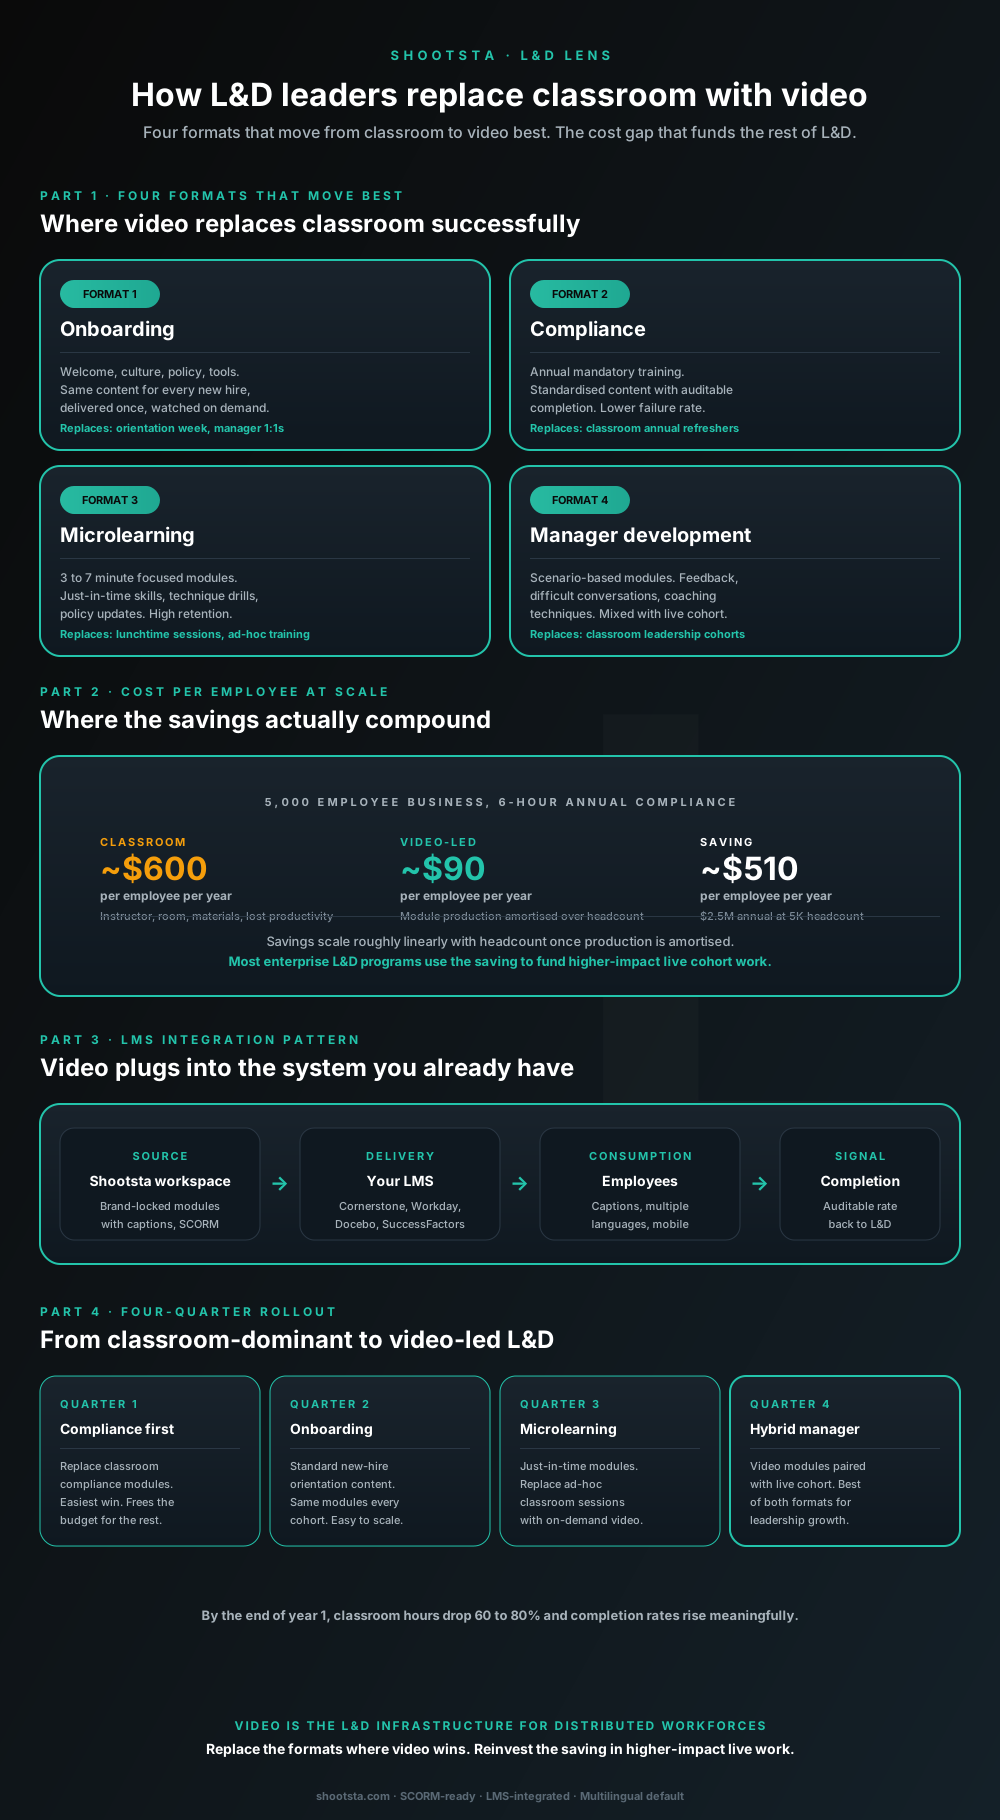
L&D leaders running classroom-heavy training programs typically have the largest single opportunity in the business to free budget through format change. Four training formats move from classroom to video cleanly; the savings fund higher-impact live work. Here is the rollout that compounds learner adoption over four quarters.
How customer success leaders should use video
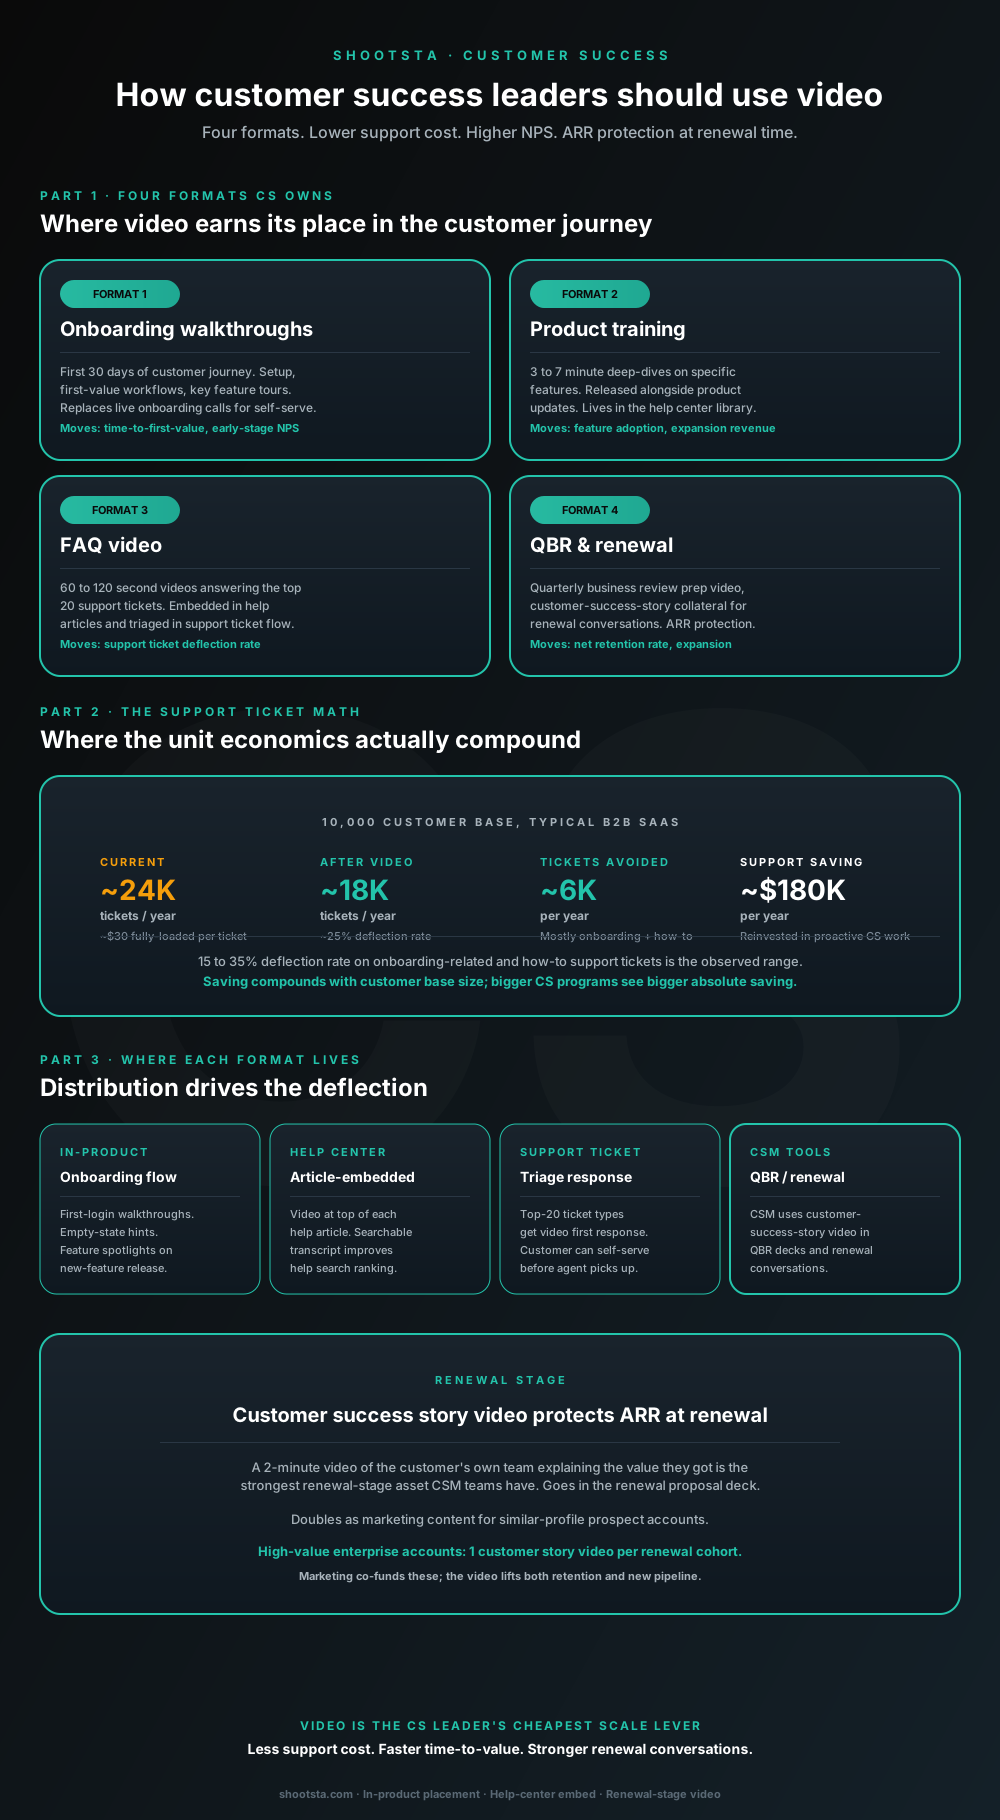
Customer success leaders are usually under-resourced for both reactive support volume and proactive retention work. Video is the cheapest lever to fix both - 15 to 35% deflection on onboarding and how-to tickets, faster time-to-value, and renewal-stage customer story video that lifts net retention. Here is the four-format model and where each piece earns its place.
How internal comms leaders should use video
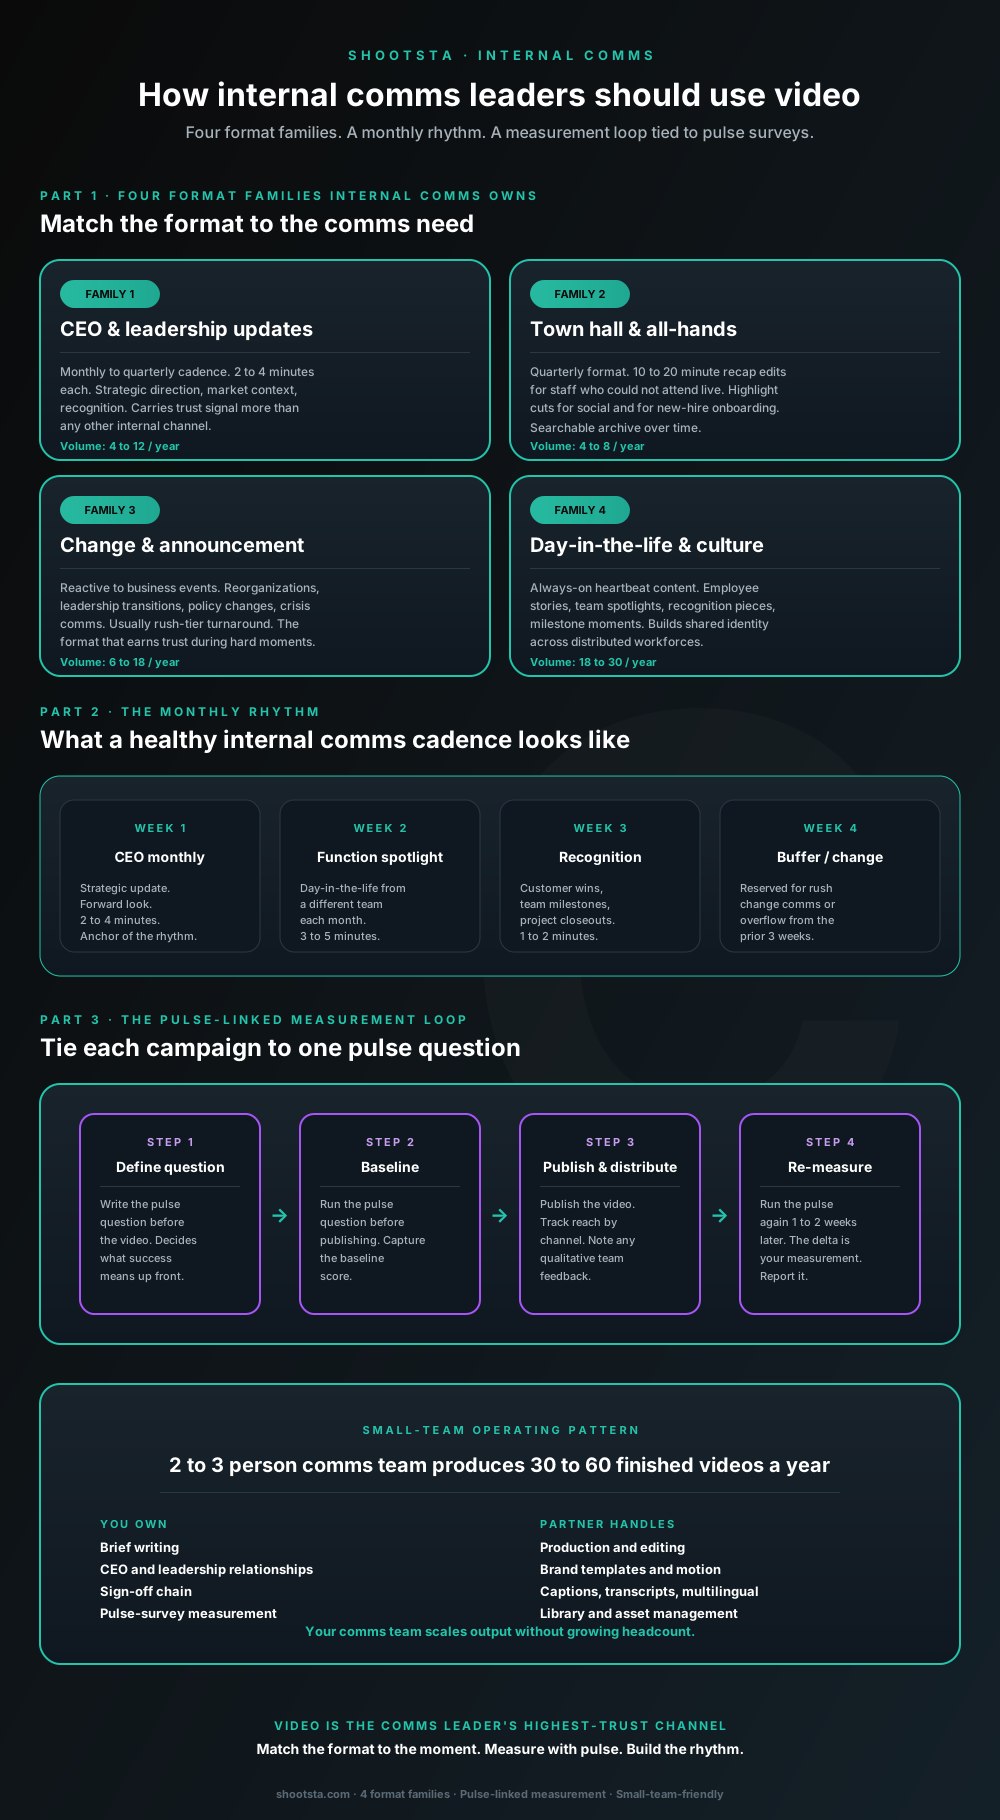
Internal comms leaders are usually under-resourced for the volume of video the business actually wants. The fix is not more headcount; it is structuring the program around four format families, a monthly rhythm, and a pulse-survey-linked measurement loop. Here is the operating pattern that lets a small comms team produce 30 to 60 finished videos a year.